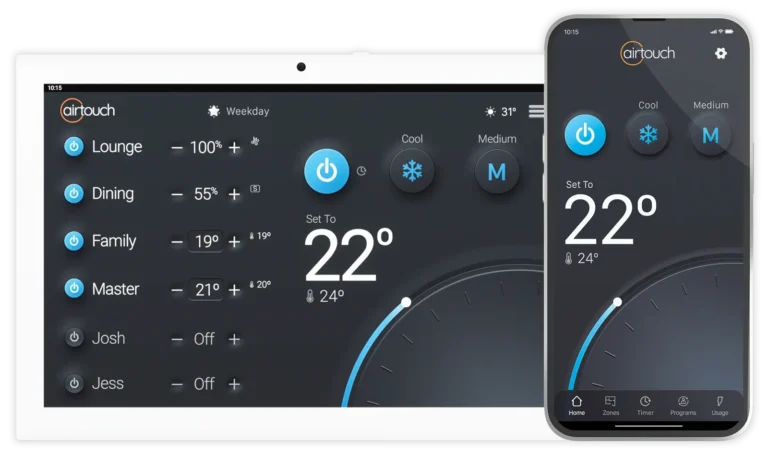
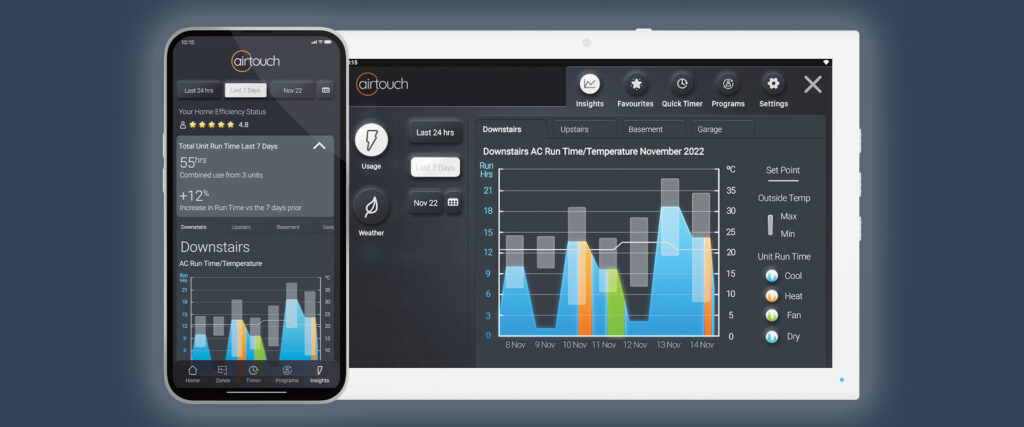
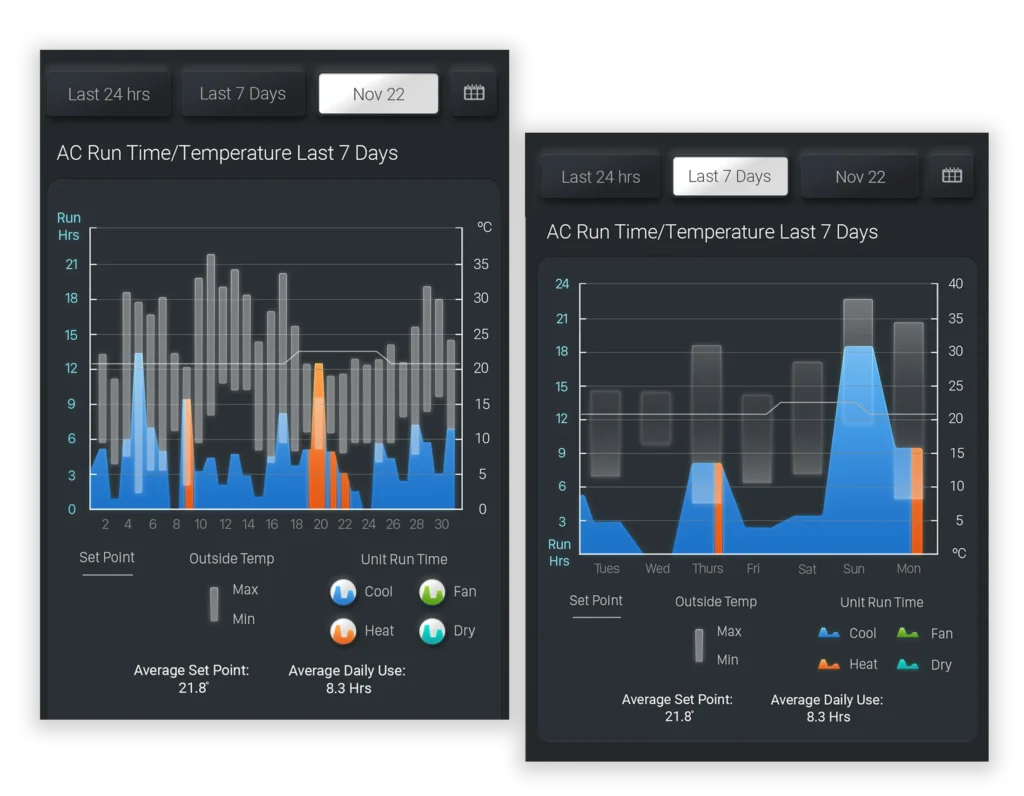
One of the unique aspects of AirTouch 5 is its ability to compare your AC’s usage against local weather conditions. By doing this, you can understand if your AC usage aligns well with the external temperature. For instance, see if you are using the heating mode when it’s relatively warm outside. It’ll help identify days when there might have been an over-reliance on climate control, especially when the weather outside was mild, which can be a clear signal for potential energy wastage. AirTouch can help you identify this and save in the future.
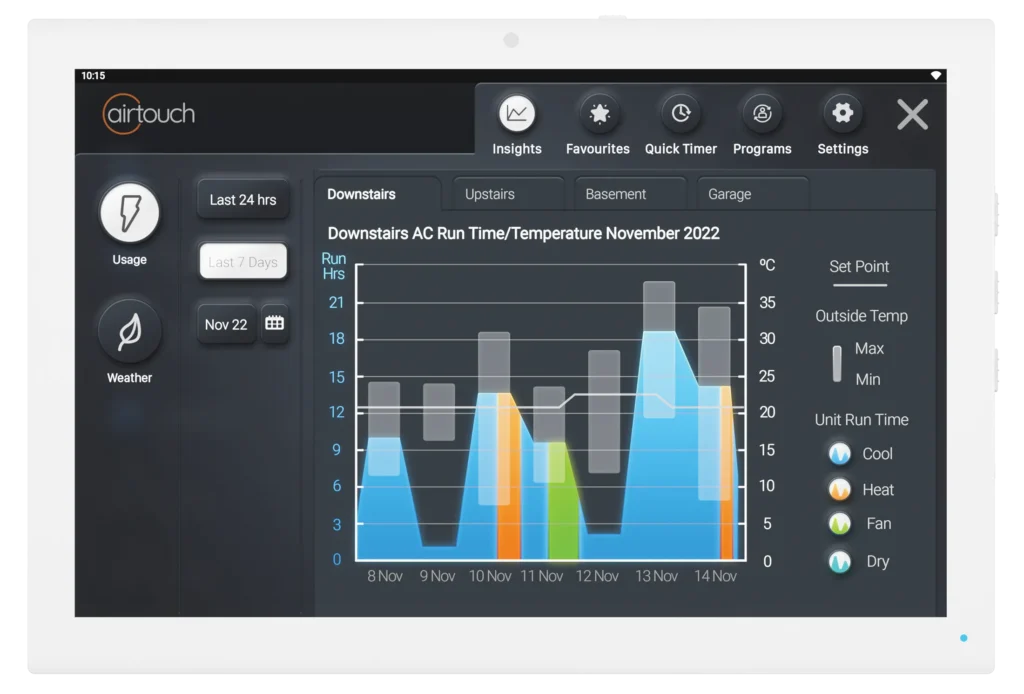
AirTouch 5’s graphs are intuitively designed to provide homeowners with a clear and detailed understanding of their AC usage.
Included Metrics
Temperature Settings: It displays the temperature at which users have set their ACs, allowing them to observe any anomalies or inconsistencies.
Runtime: This metric tracks how long the AC has been running, and providing insights into its operation patterns.
Mode of Operation: Whether it’s cooling during a blistering summer afternoon or heating during a frosty winter morning, the graph displays which mode the AC was operating in.
Comparison with Local Weather: One of the standout features of AirTouch 5 is its ability to juxtapose AC usage with the prevailing local weather conditions. This gives users a clear picture of whether their climate control decisions align with external temperatures.
Tracking Usage over Time
The flexibility of AirTouch 5’s graphs extends beyond just immediate insights. Users can delve into their energy usage patterns over different periods:
24-hour Cycle: Understand daily consumption patterns.
Weekly Review: Identify days of peak usage or minimal usage.
Monthly Overview: Get a broader perspective on consumption trends over an extended period.
AirTouch 5 is not just about providing information; it’s about empowering users. With the data in hand, homeowners can identify over or unnecessary use or optimise their temperature settings. By understanding their comfort levels and comparing them to external temperatures, users can set their ACs at optimal temperatures that provide comfort without excessive energy consumption.
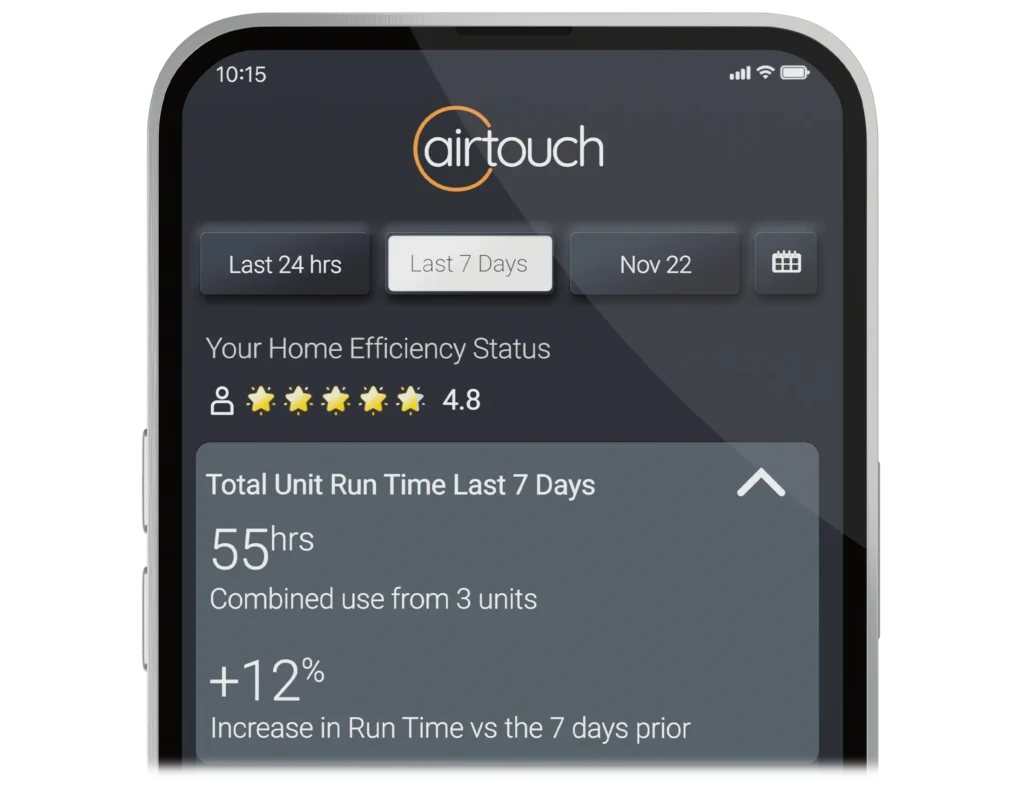
AirTouch 5’s air conditioning usage graphs are an example of how technology can guide us toward sustainable living. By offering insights into our energy consumption patterns and comparing them to local weather conditions, this system enables us to make smart, informed decisions. As we increasingly move towards environmentally conscious living, tools like AirTouch 5 can help.

